
Using Metrics in E-Discovery
EDRM is a cooperative industry organization created to address the need for standards and guidelines in the e-discovery market.
The mission of the EDRM Metrics Project is to provide an effective means of measuring the time, money and volumes associated with e-discovery activities. In addition, the Metrics model group is responsible for creating tracking, reporting and measurement protocols to assess e-discovery activities, and, to the extent metrics data becomes available, begin analysis of that data.
Having a defined approach and understanding the numbers early in the e-discovery lifecycle provides four key advantages:
- The ability to quickly estimate the time to complete the e-discovery process (and plan accordingly),
- The ability to estimate the potential costs early in the process and make appropriate changes in legal and operational strategy,
- The ability to reduce the legal risk of failing to collect all the relevant documents and of failing to meet the production timetable,
- The ability to reduce the time to get a first, internal look at the dataset to understand the strength of the plaintiff’s case
Background
This study, developed by the Metrics working group, highlights appropriate metrics and best practices that can be used in three key phases of the Electronic Discovery Reference Model (EDRM); Collections, Processing and Review. The requirements are based on a hypothetical employment-related lawsuit developed by the EDRM Search working group to identify best search strategy practices. In this scenario, a Silicon Valley based company, Dynatronics, Inc., is sued by a former director, Patricia Perez, for gender discrimination and wrongful termination. Dynatronics retains Eagan & Escher as its counsel and outsources production and review to LitSpecialists, an e-discovery firm specializing in this area.
Approach
For each stage, Collections, Processing and Review, this study explains:
- Why collect metrics?
- What needs to be measured?
- How are metrics acquired?
- Where are metrics recorded?
- What can we do with the metrics?
This study also provides examples of typical reports that would be used by the Dynatronics legal team.
Collection
Why Track Metrics During the Collection Stage?
Dynatronics counsel has approved collection of the first wave of potentially responsive ESI. They have selected a number of primary custodians and shared sources found during the Identification interviews and activities. Counsel needs ongoing and summary reports on the actual volume identified and in order to create rough cost calculations to support ongoing filings and negotiations on the scope. Tracking metrics can aid in the filings and scope defining process to:
- Help legal counsel understand the estimated size of the purposed collection.
- Utilize historical data to estimate the size if available, if not perform preliminary searches and collections if possible.
- Help legal counsel understand the impact of using specific key words and custodians for collections.
- Show that performing a properly scoped search can dramatically decrease the cost of the processing.
- Enable defensible cost accounting by tracking the actual item count and volume of the collection.
- Identify gaps or unexpected non-relevant content by comparisons with estimates and across custodians/sources.
What Should be Measured During Collection?
The Dynatronics case focuses on employees and communication file types. It is decided to track the volumes by custodian by data type, except for any corporate-wide sources without custodial level retrieval systems. Useful metrics to track include elements such as:
- Initial volumes identified for collection
- Item count and potentially responsive data volume
- Location – including physical location as well as appliance locations
- File classification (i.e. archived .pst or MS Office documents)
- Date of collection
- Collection agent
How Are the Metrics Tracked?
An Excel spreadsheet based on the EDRM metrics codes is used.
How Can the Metrics be Used?
- The total volumes are used to calculate in-house and service provider estimated costs reports to counsel in an attempt to further shape discovery work efforts.
- The metrics are used for quality control to make sure that there are no large gaps within the volumes initially identified compared to the actual volumes collected.
- The file types are used to help estimate the potential processing costs of the collection and possibly identify the most apt legal review platform.
How Do You Scope the Collection?
- Interview custodians and determine the location and volume of relevant data.
- Identify which employees and outside parties are involved in the case
- Identify where is the data stored e.g. local hard drive, network share, archive etc.
- Assemble a Level of Effort for collections from the varied data sources and prioritize data sets to collect based on their accessibility (Production, Near-Line, Off-Line etc.)
How Should I Approach the Data Collection?
The approach should follow a well defined methodology:
- Work with System Administrators to determine available options for collections.
- Determine if you have adequate storage for the collection.
- Identify the data types, for example, Email, Word documents, etc.
- Select a collection tool based on the data type criteria.
- Collect the relevant data in a forensically sound manner so that it can be processed and produced for the case.
- Use the supplied exemplar Collection Estimation template to measure the data that is collected.
- Utilize this data for QC and process improvement.
- Document (Chain of Custody) how the data is collected and preserved and transformed throughout the collection lifecycle – for example, every time the data moves, the media used, dates, who performed the collecti3on, tool used, etc.
This will strengthen the defensibility of your collections if they ever come under scrutiny.
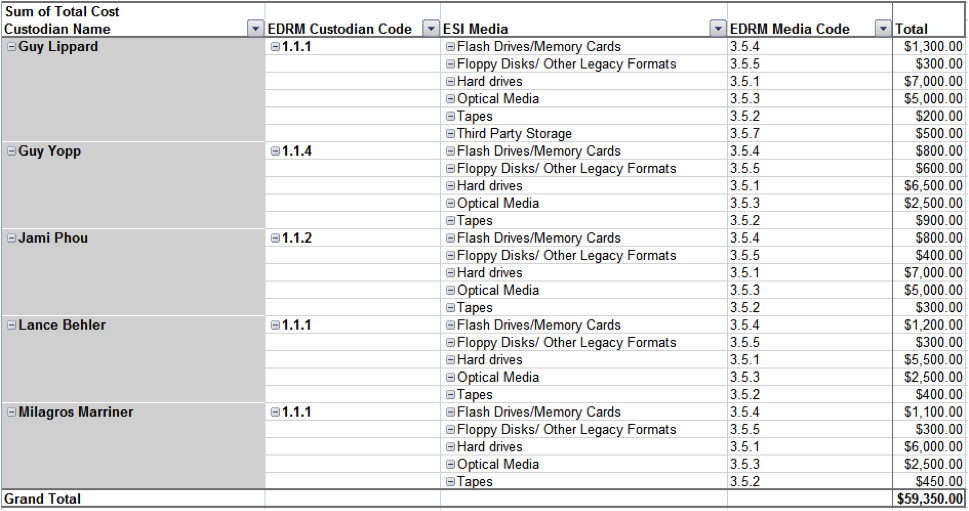
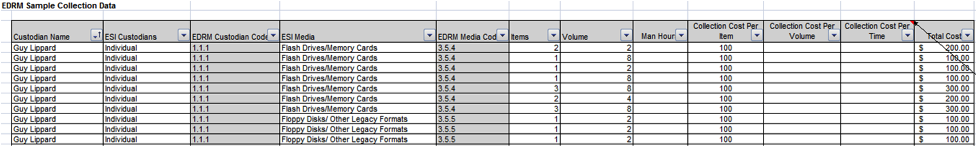
Metric Examples from the EDRM Collection Tool Spreadsheet:
Processing
Why Collect Metrics in the Processing Stage?
Dynatronics has collected ESI from all of the custodians and corporate shared sources. As these collections are processed, some items cannot be processed or converted to load in the review system for a number of reasons. Counsel has requested a running report on exception items and items that could not be reconciled. Processing and review (which may run concurrently) are the two longest and most expensive phases. Using metrics that describe the size and attributes of the collected dataset, coupled with the projected and actual processing rate (including the historic and actual exception rate), allows Dynatronics’ management to plan the remaining downstream processes, to minimize cost and legal risk.
What Needs to be Measured During the Processing Stage?
- Input Metrics – Describe the size and composition of the incoming dataset or processing workload received from the Collection stage,
- In-Process Metrics – Describe the progress of processing the incoming dataset, and,
- Output Metrics – Describe the final result that has been processed and the subset loaded to the review platform (to enable the Review stage to begin).
How Are Metrics Acquired When Processing Starts?
Input metrics include the total size (in bytes) of the collected dataset (by custodian) and its breakdown by file type, generated by script during the load process into the staging area.
Once processing starts, the key in-process metrics required will be the time taken and processing rate for each batch of files, broken down by custodian and file type. The exception rate (the proportion of files which fail to be processed correctly) will also be required by type, file type and custodian. Exceptions, which will increase Dynatronics’ costs and delay the start of review, fall into two categories: non-fatal exceptions which may require additional, costly reprocessing, and fatal exceptions which represent files that cannot be processed and that will have to be accounted for to opposing counsel.
Output metrics include the numbers of files processed, the duplicate/near-duplicate count, the processing rate, the fatal and non-fatal exception rates, the number of pages in each file and the number of images produced (depending on the processing capability, the review method and the capability of the review platform). The output metrics should also include the responsiveness rate, i.e., the number of files identified (by custodian) as responsive in the searches of the processed data and which were flagged for subsequent review.
Where Are Metrics Recorded During the Processing Stage?
Processing metrics are generated by a number of different groups. Careful attention was paid by Dynatronics, LitSpecialists, Inc. and Eagan & Escher at the start of the project to the source and format of the metrics data and how reports from each different stage (Collections, Processing, Review and Production) would be coordinated and reconciled.
What Can We Do With the Processing Metrics?
- Input Metrics – Can be used to estimate the time to complete and total cost of the processing phase based on standard assumptions (i.e. vendor processing rate, exception rate, responsiveness rate).
- In-Process Metrics – Can be used to update the initial time and costs estimates based on the actual rates observed by each batch of files processed. Additionally, early review of In-process metrics may enable problems to be identified, for example with a large number of exceptions and an alternative strategy developed to deal with them. Better estimates of completion times will enable a more effective utilization of review resources – which may be operating in parallel with the ongoing processing – providing more time for review.
- Output Metrics – Can be used to ensure that all data received was actually processed or otherwise accounted for. Careful analysis of file types and exception data may allow negotiation with opposing counsel to avoid further costly re-processing. Having defined processes and detailed record keeping will ensure that any mistakes will not result in judicial censure and summary adverse judgment.
Example Exception Report – Breakdown by Error Message and Type, with Counts
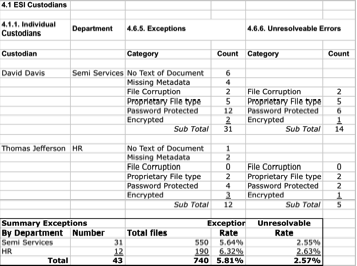
This report allows Dynatronics to assess the volume and types of exceptions in its collection, separating them into actionable vs. non-actionable (unresolvable) categories.
The report also allows Dynatronics to estimate the additional costs (say $30 per exception) and additional time needed to re-process the exceptions. Using historical rates allowed Dynatronics to make better cost estimates during the collection phase, providing them extra leverage at the “Meet and Confer” stage, and to limit costly reprocessing before it occurred.
Review
Why Collect Metrics in the Review Stage?
Document review, generally acknowledged as the costliest component of e-discovery also involves the greatest coordination among a number of participants (in-house counsel, the outside law firm, the review platform vendor, and the staffing vendor). As the collected ESI has been processed and uploaded into the review system, LitSpecialists will start the review. Documents will be reviewed for their relevancy and coded as to responsiveness or reasons for being withheld entirely or in part from production. The client and Eagan & Escher are eager to assess the number and content of documents to be produced. The review is also under a complex schedule and a closely-watched budget. LitSpecialists will provide progress reports monitoring review rates, to manage expectations and to keep the review team on target, and document statistics, to project the time and cost of production.
The use of metrics in the Review Stage ensures deadlines are met, tracks the cost of the review and helps prepare for production. But beyond those short-term goals, consistent capture and use of review metrics can establish baselines for projecting timeframes and budgets, as well as preferred review platforms and review team composition.
What Needs to be Measured in the Review Stage?
The metrics for Review are derived from both the review platform and the reviewers.
- Pre-Review Metrics: Describe the size and composition of the dataset to be reviewed, including foreign languages, image files, media type, and spreadsheets, the size and composition of the review team, and the timeframe of the review;
- Ongoing Review Metrics: (during a review) Include: the hours worked (billed) by the reviewers; the hours logged on the review platform by the reviewers; average hours worked and logged; number, type and average number of documents/pages coded ; the number/percentage of documents checked for accuracy (QC); the documents unable to be reviewed; any non-viewable documents/pages; error rates; review exceptions; and any system downtime;
- Post Review Metrics: Describe the aggregate of documents loaded (the original dataset, plus additional files loaded during the course of the review); total hours necessary for the review; average review rates for the team/reviewers; total documents/pages reviewed; totals of categories (e.g., Responsive, Non-Responsive, Privileged, Confidential, Further Review, Not Viewable); total downtime.
How Are Metrics Acquired in the Review Stage?
There are three sources of data for review metrics: the review software; the reviewers themselves; and/or the review manager(s). The review software will embody the universe of documents – size of the files to be reviewed and attributes of those files. It can also show the totals for hours logged on, and number of files reviewed and coded. Beyond these fundamental metrics, the availability of certain data is dependent on the type of reports generated from software used; or calculating and tracking the numbers manually. Metrics for hours worked/billed and system downtime, would be acquired from the reviewers.
Where Are Metrics Recorded in the Review Stage?
Review metrics are generated by a number of different groups. Here, all metrics are being recorded in Excel spreadsheets so that the phases can be combined to create a summary of the winnowing of document volume to relevance.
What Can We Do with the Review Metrics?
- Pre-Review Metrics – Can be used to estimate time and costs for completing review based on standard assumptions (i.e. average reviewer rate, document types, platform performance); can be used to determine staffing needs to meet budgetary and time constraints of the review phase.
- Ongoing Review Metrics – Can be used to update the initial time and costs estimates based on the actual rates observed in each batch of files reviewed; can be used to adjust staffing and schedules, or renegotiate production deadlines. Ongoing metrics can also be used to identify problems with the review platform and/or certain file types, as well as for early or timely feedback on identification, preservation and collection or possible recollection.
- Post Review Metrics – Can be used to ensure that all documents processed were actually reviewed or otherwise accounted for. With corporations in more regulated or litigated industries, review metrics can set a baseline for predicting costs and timeframes of subsequent reviews.
Example of Review Metric Reports
The Document Review Status Report below shows in some detail the volumes of documents that have and have not been reviewed, and how they have been coded.
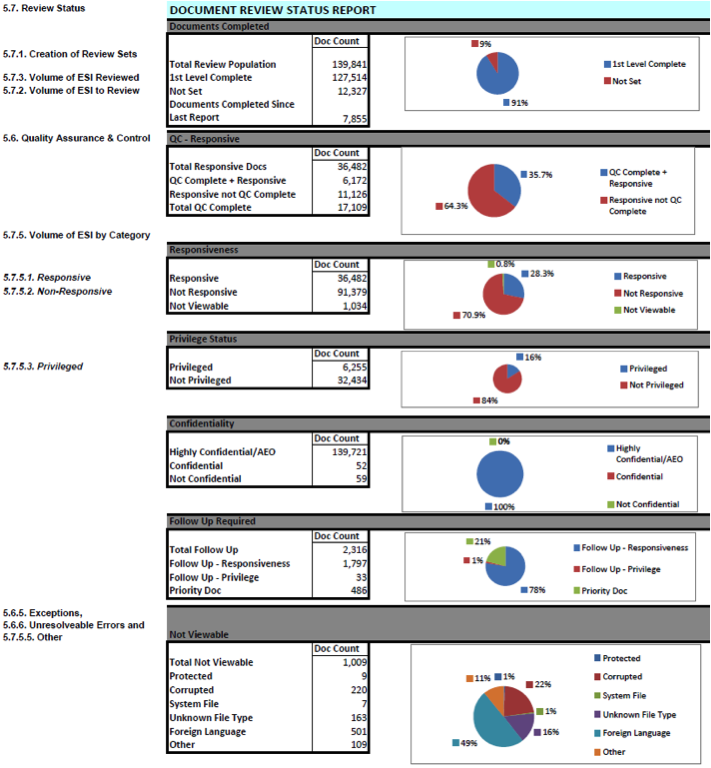
As an ongoing report, LitSpecialists will use it to monitor the rate at which the review has been advancing and to report their progress to the client and counsel.
For Dynatronics and Eagan & Escher, it also shows the proportions of documents from the collection set as they were coded and that may be included in the production.
The surprise was the high level of foreign language documents reported here. The team immediately revised their review staff to include the appropriate foreign language speakers as well as updated their budgets to account for the additional costs.