
About the Model
The Metrics Model provides a framework for planning, preparation, execution and follow-up of e-discovery matters and projects by showing the relationship between the e-discovery process and how information, activities and outcomes may be measured.
Elements of the Metrics Model
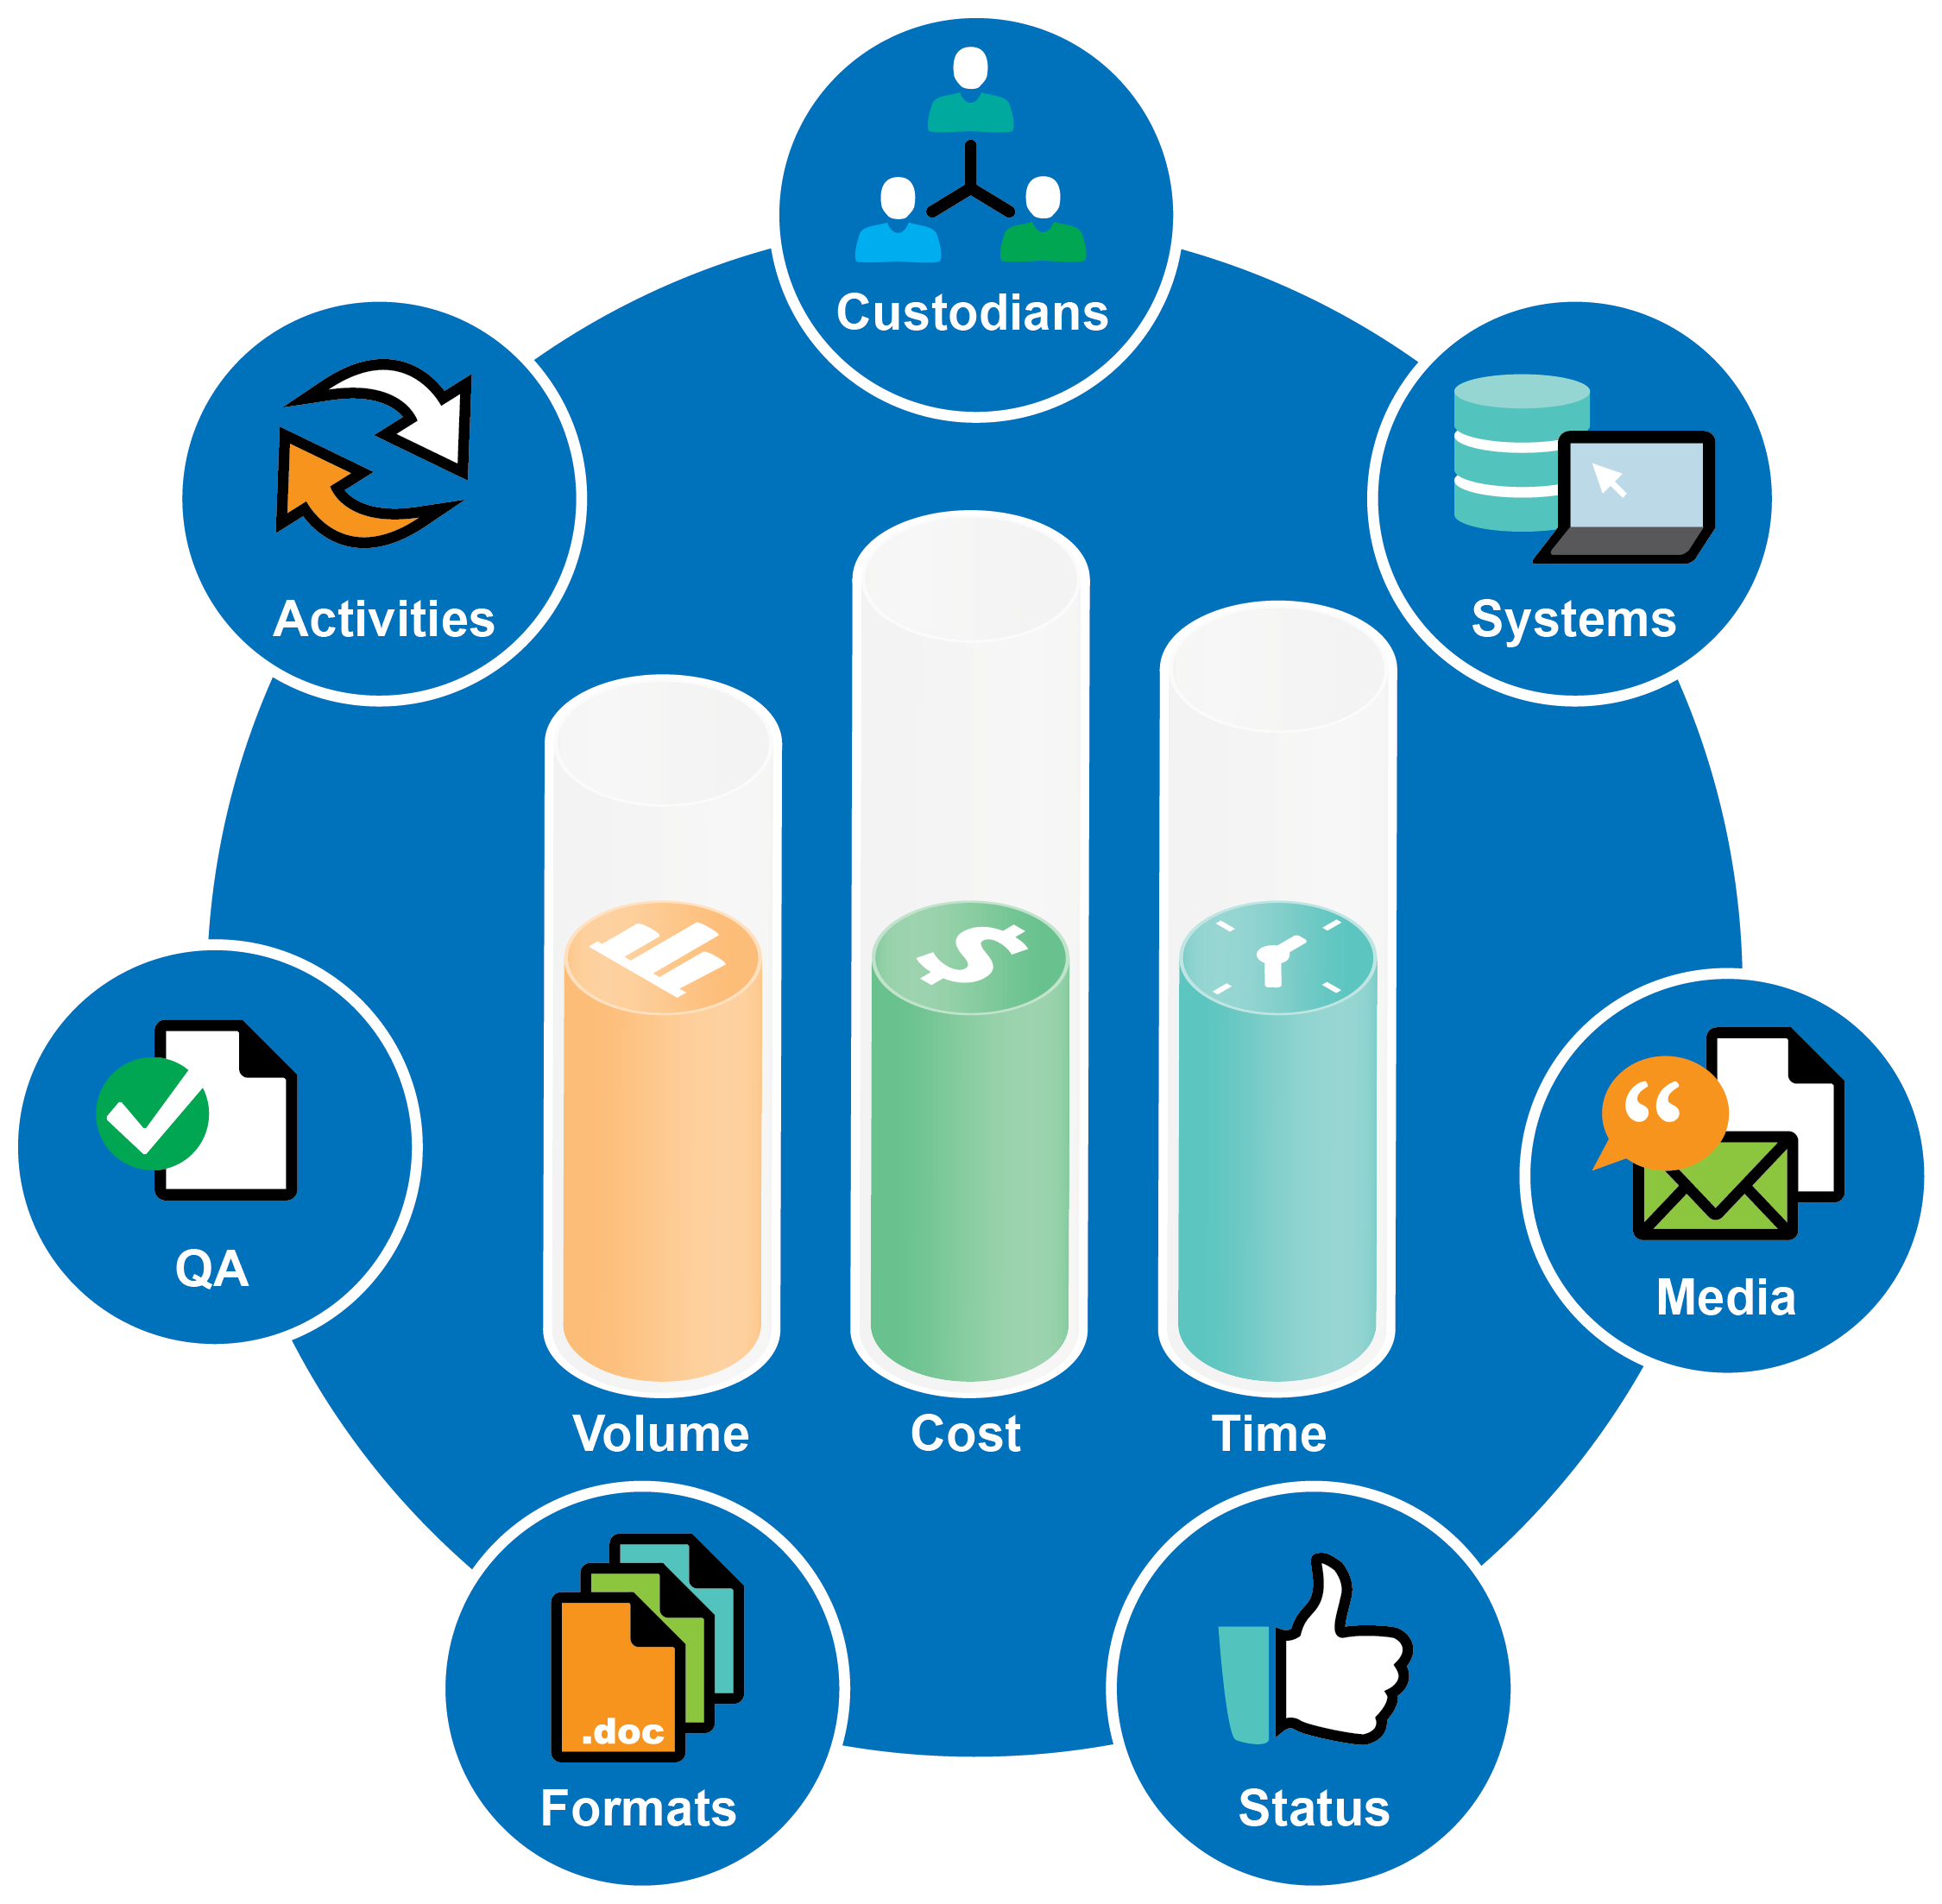
The Metrics Model consists of two inter-dependent elements: (a) The Center, which includes the key metrics variables of Volume, Time and Cost, and (b) the elements of the Contour, or outside nodes, which indicate seven aspects of work which affect the outcome associated with the elements at the Center. Because each of the seven nodes could be a factor at any stage of an e-discovery project, there is no indicated starting node on the Metrics Wheel.
Information at the Center
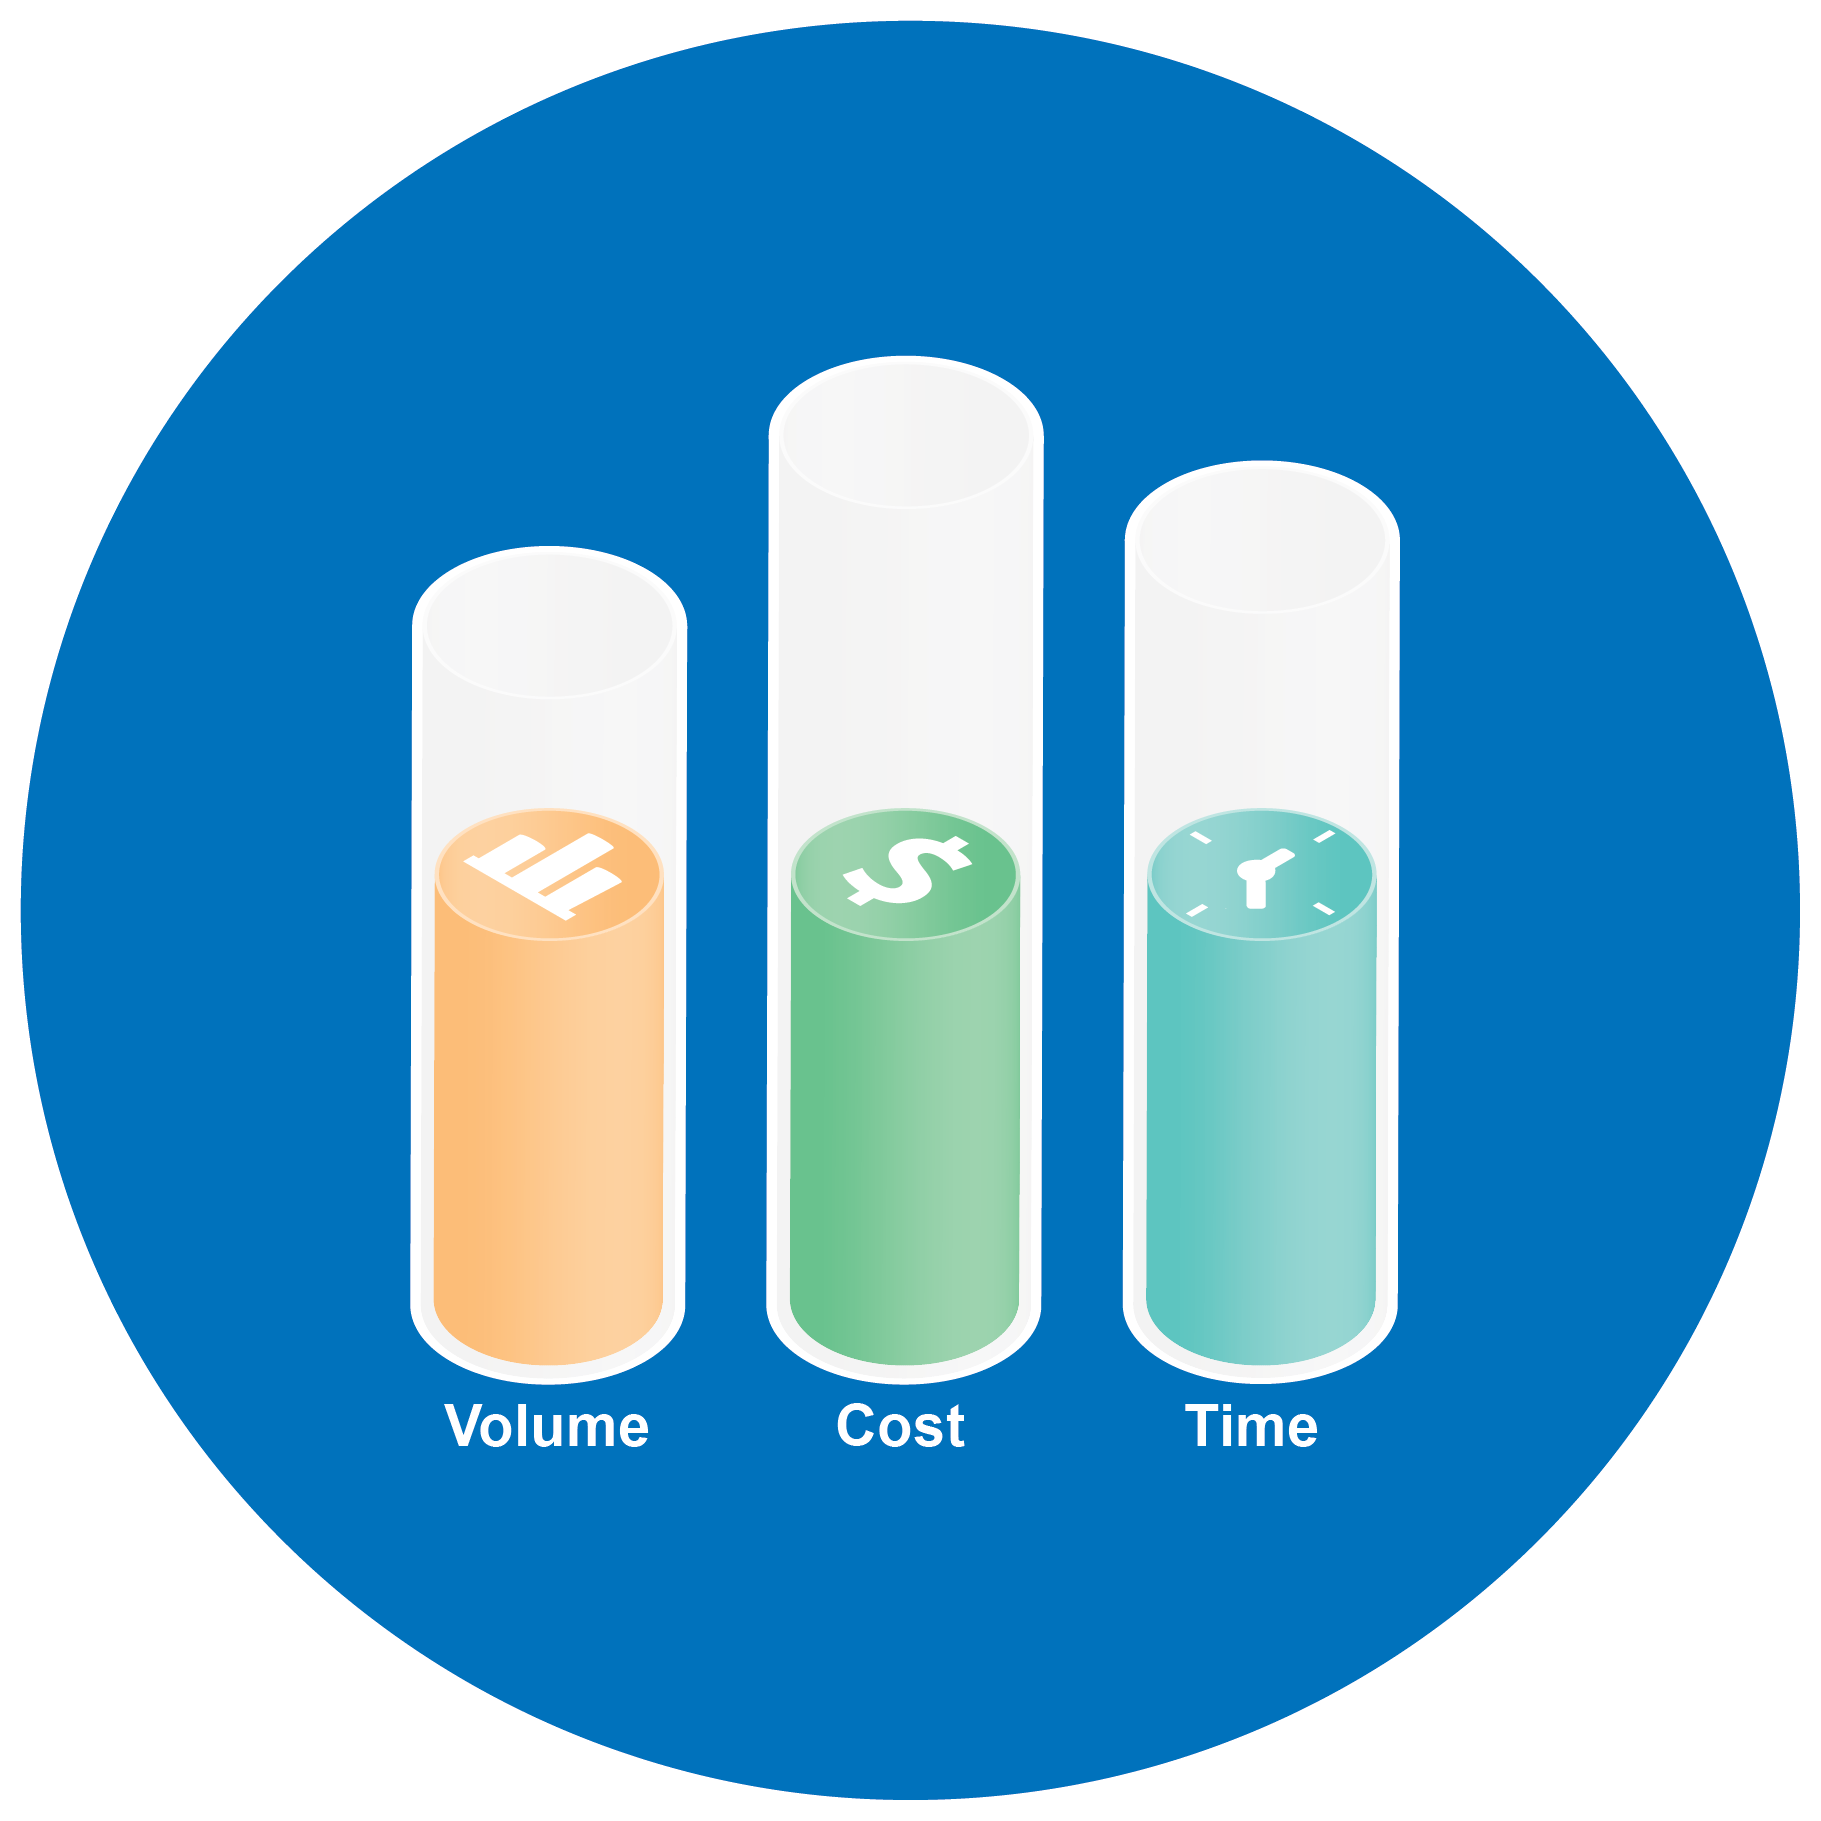
The Metrics Model depicts Volume, Time, and Cost at its center, as all the constituent elements around the Contour along each of the nodes impact each of these three major variables. Time, Cost, & Volume are inter-related variables that will fluctuate for each project. The center elements contain ghosted elements within each bar, to illustrate that each of the Volume, Time and Cost variables depend on the choices made at each node during the project.
The principal variable, represented by the longest bar, is Volume because it usually has the greatest impact on the Time and Cost of a project. “Volume” refers to the amount of data, such in total file size or number of files, in the eDiscovery collection. A larger volume of data will generally increase the Time required for a project due to the increased time needed to collect, process, review, and produce the data; consequently, as much, eDiscovery activity is billed by time, a larger Volume will tend to increase the Cost of the project. If the Volume of data decreases, Time & Cost will also likely decrease. However, other variables affect the overall relationship between Volume, Time and Cost. For example, the Time & Cost associated with a potentially large Volume of data can be reduced by one or more of the following: targeted collection strategies; rigourous culling during processing; knowledgable eDiscovery practitioners; and Computer Assisted Review (CAR).
Information on the Nodes
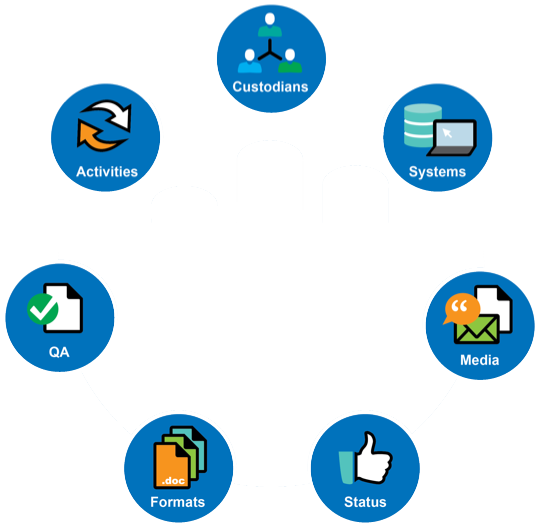
The seven nodes around the outside Contour of the Metrics Wheel are seven aspects of eDiscovery work which most frequently affect the outcome associated with the elements at the Center. Because each of the seven nodes could be a factor at any stage of an eDiscovery project, there is no indicated starting node on the Metrics Wheel. For example, the Activities undertaken can have impacts on each of the Volume, Time and Cost. The number of Custodians can affect the Volume of data, impacting Time and Cost. The number, type and complexity of Systems from which collection occurs can impact Time and Cost, and also Volume. The Media from which items are collected, or which are used to produce, affect Cost. The Format of data, at each of the preservation, collection, review and production phases, impacts Volume, and Cost. The Status of any project, including the phase of the EDRM cycle and whether the project is on- or off-budget or schedule affects matters of Time and Cost. The extent of QA available and required will impact Time and Cost.
Time can be measured by standardized cost codes and in particular the UTBMS L600 series, which was developed and implemented by LEDES. The L600 series of cost codes are specifically designed to capture Time associated with eDiscovery. The L600 series of cost codes can be implemented within many of the electronic billing software applications available. Within the Metrics Model With Text, we outline the various L600 codes and how these map onto the nodes around the Contour of the Metrics Model.
Other items within the eDiscovery effort can be captured by lists, and these items are listed within the Metrics Model With Text. Listed items can be measured and monitored as part of the process of managing Time, Cost and Volume.
Here is a description of the seven Nodes:
Activities

Things that are happening or being done by either people or technology; examples can include: collecting documents, designing a search, interviewing a custodian, etc.
Tracking activities is essential to ensure timely and cost-efficient project completion. Pre-planning activities will provide a basis for budgeting, understanding, and allocating the resources, time and money required for the eDiscovery project. When a project is underway, activities form the basis for tracking time spent, and are the foundation for the UTBMS L600 Codes. Activities can generate further items to track.
Custodians

Person having administrative control of a document or electronic file or system; for example, the custodian of an email is the owner of the mailbox which contains the message.
The number of custodians can be a significant factor in the Volume of data to be collected and can therefore affect costs. The number of custodians may also affect the time required to conduct interviews and collections and can increase the complexity and costs associated with preserving and managing data.
Systems

The places, technologies, tools and locations in which electronic information is created, stored or managed; examples of systems include shared drives, email, computer applications, databases, cloud sources and archival sources such as back-up tapes.
The number of systems implicated in a preservation or collection effort can contribute to larger volumes of ESI and increase costs, processing time or complexity and affect the time required and cost of, subsequent steps. The number of systems alone, however, does not necessarily mean larger volume. Correctly identifying systems will be necessary in order to properly plan and budget for the eDiscovery process, and for compliance with legal requirements for disclosure and production.
Media

The storage devices for electronic information; examples include: CDs, DVDs, floppy disks, hard drives, tapes and paper.
In order to ensure that all the relevant information is accounted for media tracking is utilized. As well, data volumes can affect the choice of media.
Status

A unique point in time in a project or process that relates to the performance or completion of the project or process; measured qualitatively in reference to a desired outcome.
Regular tracking of projects against desired milestones can contribute to greater efficiency and time and cost savings. Ensuring that a project is on track can facilitate better budgeting and planning. It can also contribute to effective communication with all parties involved, including the court.
Formats

The way information is arranged or set out; for example, the format of a file which affects which applications are required to view, process, and store it.
The format in which documents originate, and move though the EDRM project lifecycle, can be a factor which influences the costs and the time required to complete tasks. Decisions need to be taken regarding formats of data, media, production and presentation, bearing in mind the impact of the choice on task or project completion. For example:
- the timing of TIFFing documents can impact the cost of future phases in the discovery project (e.g. during processing, at production or for presentation);
- the format of documents can affect the processes and technologies used for document review; and
- how information is preserved and collected can affect data volumes and the costs and timing required in the eDiscovery effort.
Quality Assurance (“QA”)

Ongoing methods to ensure that reasonable results are being achieved; an example of QA would be to ensure that no privileged documents are released in a production by performing a operation, such as checking for privilege tags within the production set.
Quality Assurance can encompass many activities, but refers to those that are performed to control the quality or outcome of a task or project. Quality Assurance is a recommended best practice in all phases of the EDRM lifecycle. Implementing quality assurance into projects can reduce cost by ensuring that the work is completed timely and accurately, and can contribute to lowering the time required to complete tasks and projects.
Not all Quality Assurance is task based, and can consist of checklists and tracking mechanisms. Many metrics are themselves a form of quality assurance.
Frequently Asked Questions
How can the Metrics Model be used?
The Metrics Model is a tool that provides a visual representation of the inter-relationships and dependencies among tasks and activities across the EDRM framework, identifying what can be measured and how, and by whom. It aims to help e-discovery participants understand the various elements, tasks and activities of projects, and how they combine to use resources and funds. Understanding the Metrics Model can contribute to effective and timely decision-making at all phases of an e-discovery project, ensure the effective deployment of resources and assist in managing and controlling cost and risk.
Who can use the Metrics Model?
EDRM encourages you to use the diagram to facilitate better cooperation, cross-functional processes and better project management of e-discovery matters and projects at your company or for your constituencies. Corporations, law firms, vendors and service providers, and e-discovery project managers and consultants can use the Metrics Model to facilitate dialogue about the elements of a project or engagement, and how these will be performed and completed, and at what cost.
How was the Metrics Model developed?
This diagram was developed from multiple inputs, including:
- Interested parties with expertise in e-discovery from vendors, law firms, and corporations
- Community effort
- Series of bi-weekly sessions over five (5) months
- Preparation and circulation of draft model schematic and draft text
- Agreement among parties on final draft model and text
- Review by EDRM group
- Publication for public comment
- Incorporation of public comment into model finalization
What is the relationship between the Metrics Model and the UTBMS L600 Code Set?
The Metrics Model is unique in that itprovides a visual representation of the inter-relationships and dependencies among tasks and activities across the EDRM framework, identifying what can be measured and how, and by whom. The model relates the metric types, aspects, and EDRM phases to the UTBMS Code Set developed exclusively for e-discovery purposes. It can help e-discovery participants understand the various elements, tasks and activities of projects, and how they combine to use resources and funds.
What if the Metrics Model does not reflect how my company manages e-discovery projects?
It probably doesn’t, both because few companies have systematically integrated processes that link e-discovery tasks and activities across the EDRM framework to the L600 Series, and because there is no single project workflow that has been recognized as a best practice. However, because of the Metrics Model’s flexibility, aspects can be implemented in a sequential way, in order to move an organization towards greater efficiency and predictability by adopting formal processes and benchmarking and measuring aspects of eDiscovery practice.
Does the Metrics Model require me to use the UTBMS L600 Code Set?
No. Parties can benefit from using the Metrics Model even without adopting the L600 Code set. However, parties that also adopt the L600 Code Set, along with other stakeholders in their e-discovery efforts, will find that they have a consistent method of measuring the various activities, tasks and items provided for the in L600 Code Set, which might increase the accuracy of measurement and improve metrics development and analysis.
Why isn’t the Metrics Model prescriptive on what activities, tasks, tools and technologies are required?
The Metrics Model is an initial step for companies, law departments and service providers to enhance understanding of how the use of metrics can contribute to effective project management, and risk and cost containment. The Metrics Model is a tool to illustrate how metrics can augment and improve existing practices and processes. We anticipate building on the Metrics Model and providing a suite of tools available for corporations and service providers in the months to come. However, the Metrics Group does recommend the adoption of the L600 Code Set as a first step in developing a Metrics program, as the L600 Code Set will establish baseline metrics for e-discovery projects.